Rental Statistics
for Four Hot Markets
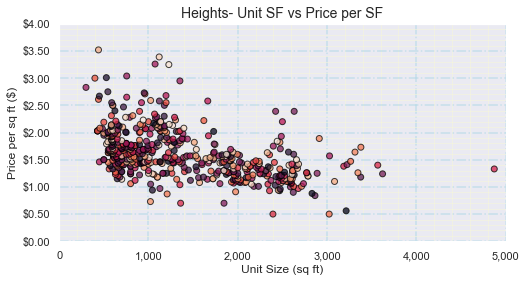
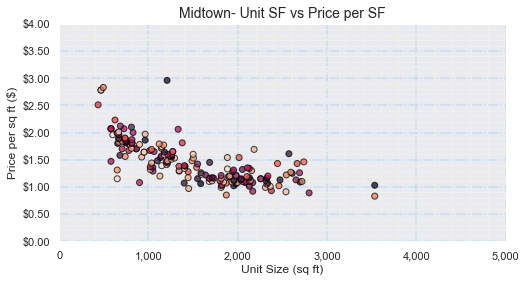
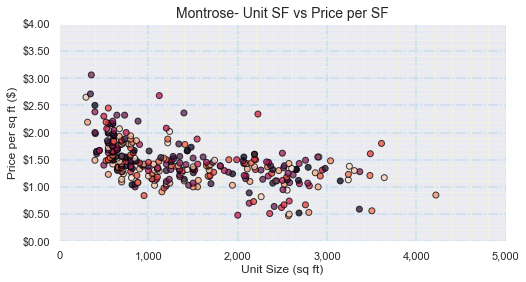
Data can be sliced and diced several ways but we will compare the rental unit square footage versus the price per square foot for our four communities. Using the price per square foot (PSF) allows the user to calculate the median price for their unit's square size by multiplication. In practice, a Realtor will narrow down units in an area by size and calculate the median PSF based on a narrow range around their target property's size.
It is also helpful to understand the PSF based on the number of bedrooms. This data is in the table below. While unit size generally increases with the number of bedrooms this data can be skewed for several reasons. A common one is the age of the property. Bedrooms in older homes, as found in the Heights or Montrose as example, tend to be much smaller than bedrooms in Midtown or in the Museum District.
| Bedrooms | Rental Price | Price/SF | Bldg SF | # Baths | # Stories | DOM |
|---|---|---|---|---|---|---|
| 1 | $1,150 | $1.64 | 700 | 1 | 1 | 35 |
| 2 | $1,800 | $1.40 | 1,244 | 2 | 1 | 32 |
| 3 | $2,700 | $1.24 | 2,152 | 3 | 3 | 30 |
| 4 | $3,700 | $1.31 | 2,850 | 3 | 2 | 29 |
| Median | $2,250 | $1.35 | 1,698 | 2 | 2 | 31 |
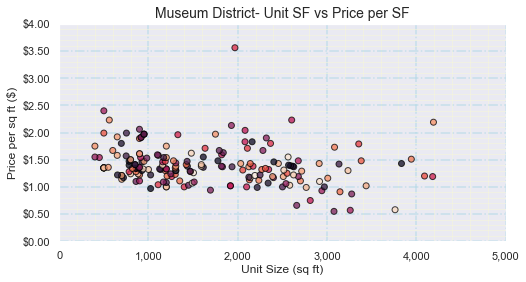
When comparing all four communities we see definite trends. With the exception of the Museum District we see a downward trend in PSF as the unit size increases...this illustrates why realtors run comparables, or, "comps" on a narrower size band to get a more accurate picture of their target property's PSF.
The Museum District has a uniform price band across all unit sizes...there is no price break for renting a larger unit here!
| Market Area | HAR Area | Rental Price | Price/SF | Bldg SF | # Beds | # Baths | # Stories | DOM |
|---|---|---|---|---|---|---|---|---|
| Heights | 9 | $2,000 | $1.54 | 1,178 | 2 | 1 | 1 | 25 |
| Midtown | 16 | $1,950 | $1.38 | 1,403 | 2 | 2 | 2 | 40 |
| Montrose | 16 | $1,485 | $1.42 | 1,118 | 2 | 1 | 2 | 34 |
| Museum District | 17 | $1,875 | $1.35 | 1,457 | 2 | 2 | 2 | 50 |
| Median | - | $1,875 | $1.41 | 1,434 | 2 | 2 | 2 | 34 |
Hot Markets
at a Glance