Rental Statistics
for Houston Real Estate
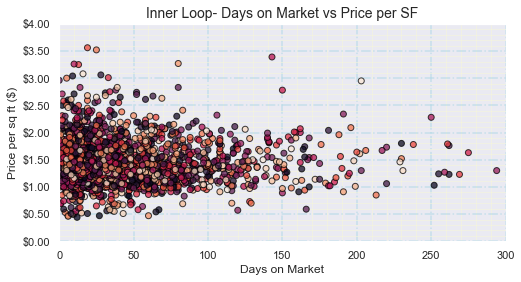
Houston is a fantastic city to live in. If you are an aspiring landlord you have to decide where to own. This is ultimately, of course, a balance between capital cost and ROI (Return on Investment) but knowing your potential rental rates can help with your calculation. HAR.com has information on rentals that includes the number of bedrooms, unit size, and days on the market (DOM) before a lease was signed.
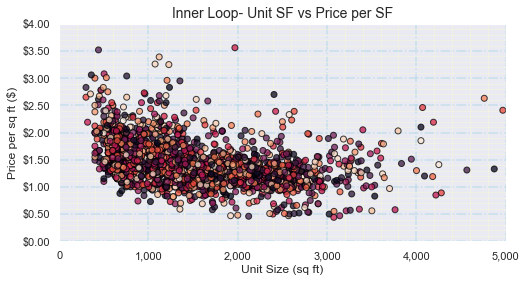
The renter needs the same kind of information that a potential landlord does. Knowing the range of price per square foot (PSF) helps the renter look in areas of town that fit their budget...but do not be afraid to negotiate! Understanding a market area's average unit size is helpful as it can shift focus towards communities that are likely to provide more options in the desired unit size.
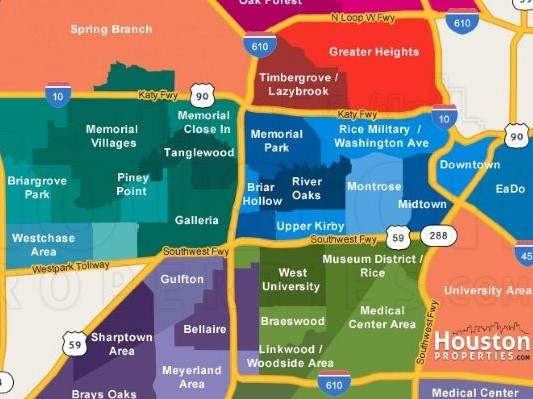
Houston Area Realtors Association (HAR, HAR.com) has divided the city into Areas and further divided it into Market Areas. As example, the Market Areas of Midtown and Montrose are both in Area 16. A summary of eleven of the hottest market areas is provided here but we are going to take a more depth look into four thriving market areas that are adjacent to one another in the heart of the inner loop: Montrose, Midtown, Museum District, and the Heights.
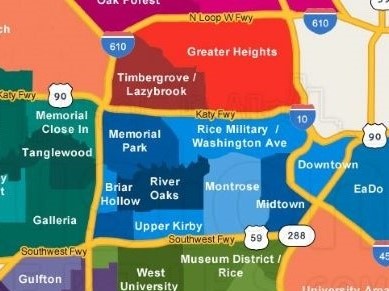
Inner Loop
at a Glance
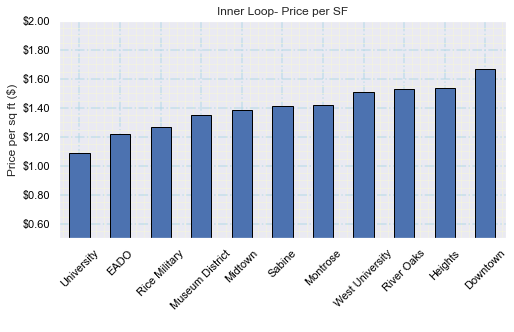
| Market Area | HAR Area | Rental Price | Price/SF | Bldg SF | # Beds | # Baths | # Stories | DOM |
|---|---|---|---|---|---|---|---|---|
| EADO | 4 | $1,750 | $1.22 | 1,454 | 2 | 2 | 2 | 32 |
| University | 4 | $1,425 | $1.08 | 1,434 | 3 | 2 | 1 | 24 |
| Downtown | 9 | $1,850 | $1.67 | 1,066 | 1 | 1 | 1 | 40 |
| Heights | 9 | $2,000 | $1.54 | 1,178 | 2 | 1 | 1 | 25 |
| Sabine | 9 | $2,750 | $1.41 | 2,074 | 3 | 3 | 3 | 20 |
| Midtown | 16 | $1,950 | $1.38 | 1,403 | 2 | 2 | 2 | 40 |
| Montrose | 16 | $1,485 | $1.42 | 1,118 | 2 | 1 | 2 | 34 |
| Rice Military | 16 | $2,650 | $1.27 | 2,191 | 3 | 3 | 3 | 30 |
| River Oaks | 16 | $1,800 | $1.53 | 1,252 | 2 | 1 | 2 | 36 |
| Museum District | 17 | $1,875 | $1.35 | 1,457 | 2 | 2 | 2 | 50 |
| West University | 17 | $2,875 | $1.51 | 1,825 | 3 | 2 | 2 | 46 |
| Median | - | $1,875 | $1.41 | 1,434 | 2 | 2 | 2 | 34 |